Excel multiple regression analysis template with advanced statistical test results and automatic forecasting options
Excel multiple regression analysis template with advanced statistical test results and automatic forecasting options
Vote: (31 votes)
Program license: Trial version
Developer: Business Spreadsheets
Version: 3
Works under: Windows
Vote:
Program license
(31 votes)
Trial version
Developer
Version
Business Spreadsheets
3
Works under:
Windows
Pros
- Advanced statistical analysis beyond Excel's built-in tools
- User-friendly interface with helpful prompts
- Results are summarized in an easily understandable text format
- Provides multiple forecasting methodologies
- Comprehensive tests for statistical validity
- Wide compatibility with Excel versions
Cons
- May be overwhelming for new users without statistical knowledge
- The detailed functionalities could seem redundant for simple analysis tasks
- Initial setup might require a learning curve for some users
Unlock In-Depth Data Analysis with Excel Regression Analysis
Comprehensive Tool for Sophisticated Data Interpretation
Excel Regression Analysis is a robust application designed to enhance the capabilities of Microsoft Excel by providing advanced statistical analysis tools. It steps ahead of the conventional Analysis Toolpak, empowering users with the ability to conduct complex analyses and make predictions based on business or scientific data seamlessly.
Detailed Statistical Measures for Validated Results
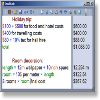
With an array of statistical measures at its disposal, Excel Regression Analysis tests the validity of your data interpretation thoroughly. It exhibits a unique trait of summarizing results in a comprehensive text format, which is particularly beneficial for users who may not be well-versed in statistical jargon. This feature ensures that the results are accessible and easily understood.
User-Centric Design for Enhanced Accessibility
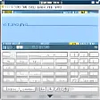
The add-in is built to prioritize ease of use with embedded help prompts that guide users through every step of the analysis process. Its interface is thoughtfully crafted to be navigable even by those with limited statistical background. The results are displayed in a user-friendly manner, promoting better understanding and decision making.
Diverse Forecasting Methodologies
Upon identifying relationships within the data, Excel Regression Analysis offers a suite of forecasting tools. Users can choose from 3rd order polynomial, 2nd order polynomial, exponential, or linear trend lines to make projections. Such diversity in forecasting options provides flexibility and enhances the predictive power of the analysis.
Robust Testing for In-Depth Insights
Excel Regression Analysis does not shy away from rigorous testing. It includes checks for statistical significance, autocorrelation, and multicollinearity, ensuring that your findings are reliable. These advanced statistical tests confirm the validity of the predictive relationships found in the data, providing you with the assurance needed to make informed decisions.
Seamless Compatibility for Excel Users
The application is designed to be fully compatible with all versions of Excel for Windows, as well as Excel for Mac 2011 and 2004. This ensures that no matter your platform, you can integrate Excel Regression Analysis into your data processing workflow without compatibility concerns.
Efficiency in Forecasting
Efficiency is a hallmark of Excel Regression Analysis. Forecasting can be executed swiftly, whether it’s on the basis of linear or exponential forecasts of independent variables. Additionally, users have the leeway to leave the forecasting fields blank for the incorporation of externally calculated data.
Conclusion
Excel Regression Analysis is a finely crafted extension for Microsoft Excel that transforms the spreadsheet software into a formidable statistical analyzer and forecaster. The application is user-centered, powerful, and compatible with a wide array of Excel versions. Its considerate design makes advanced data analysis accessible to professionals from various domains, seeking to extract value and insights from their data.
Pros
- Advanced statistical analysis beyond Excel's built-in tools
- User-friendly interface with helpful prompts
- Results are summarized in an easily understandable text format
- Provides multiple forecasting methodologies
- Comprehensive tests for statistical validity
- Wide compatibility with Excel versions
Cons
- May be overwhelming for new users without statistical knowledge
- The detailed functionalities could seem redundant for simple analysis tasks
- Initial setup might require a learning curve for some users